On the clock: Rationality — Behavioral biases in the NFL Draft
 By Richard Thaler

With the NFL draft coming up this weekend it seems like a good time to discuss the role of an unusual sort of nudge in that context. Three years ago Yale’s Cade Massey and I released a paper analyzing the NFL draft from a behavioral economics perspective. As casual fans and observers of the draft we thought that teams were falling prey to a series of cognitive biases, including overconfidence, that led them to put too high a value on picking at the very top of the draft.
Since teams often trade picks it is possible to estimate the value teams put on choosing early. That price turns out to be very high. A team can trade the first pick for the eighth and ninth picks, or the last four picks of the first round. For these prices to be rational, the first player taken has to be much better than the eighth player (since he also gets paid nearly twice as much). It turns out that performance is related to draft order, but much less strongly than these prices imply.
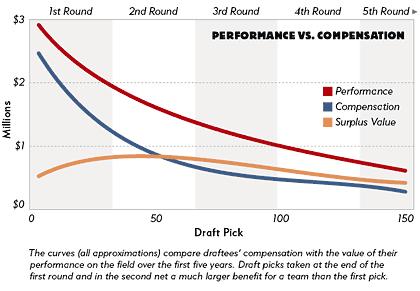
According to our calculations, the most valuable picks in the draft, meaning the picks that give teams the greatest surplus (performance value minus salary paid) are actually in the second round! Take a look at this graphic below measuring what we called a player’s “surplus value,” which is the level of the performance that a draftee brings to a team in his first five years compared with what he isactually paid. Notice that the surplus value is at its highest around pick #45.
One of the reasons why this state of affairs has persisted for many years is the existence of something that NFL insiders simply refer to as The Chart. The chart is simply a table that gives a numerical value for every pick in the draft. The first pick is assigned a value of 3,000 points; the last pick is worth less than one point. It turns out that this chart was first produced by a business partner of then Dallas Cowboy owner Jerry Jones. The Cowboys wanted a tool to help them evaluate possible trades, and The Chart simply summarized the trades that had occurred in the past few years. Although The Chart was originally owned by the Cowboys, it eventually spread throughout the league, and has become something of a self-fulfilling prophecy. When teams discuss a trade of picks, both are looking at The Chart when discussing terms.
What our paper showed is that The Chart is not an accurate measure of the true value of picks. It has been interesting to watch what has happened. The first version of our paper was circulated in April 2005 in the weeks leading up to the draft. We know that at least some teams read it, and there was much talk about the teams with the first few picks wanting to “trade down”. However, no trades took place. In fact there have been very few trades of top ten picks (Houston and Atlanta swapped the 8th and 10th picks in 2007, and Oakland traded away the 7th pick in 2005 for wide receiver Randy Moss) since our paper came out. Why not?
Suppose that every team read our paper and believed our results (a preposterous hypothesis, some teams have told us they think we are nuts, but humor me here). What should happen? In a rational world the implicit prices of draft picks would change—in particular the price of early picks would drop. The volume of trades would be the same as usual, but the prices would change. But that is not what has happened. Instead, the teams with early picks do seem to be interested in trading away their picks, but only if they can get the full value on The Chart. Since no one is willing to pay that price, they have little choice but to use the pick themselves. Already this year the Miami Dolphins, who have the first pick and could use about 20 new players, have made their choice and signed him to a contract.
This reluctance to accept a lower price when the value of something you own is similar to what we are now seeing in the housing market. When home prices fall, as now, volume of home sales tumbles, and the inventory of homes on the market rises. No one wants to sell there home for 20 percent less than their neighbor got just a year ago, but meanwhile they are paying taxes and upkeep on an empty home!
One last thought about the draft. Some teams have responded to the problem with The Chart by producing a New Chart. There is an interesting story about this in ESPN the Magazine, which you can only read if you are a subscriber. You can, however, see the New Chart thanks to an enterprising NFL fan. If you watch the draft this weekend you may hear the commentators talk about this. If there are trades of picks, watch to see whether it is the old or new chart that is being used. If something interesting happens I will blog about it next week.


March 8, 2009 at 12:40 am |
Where can I find the ESPN the Magazine article about the New Chart?
March 14, 2009 at 11:09 pm |
Whoa I would never have guessed that the most valuable picks came in the second round. Amazing to see how new information can be gathered by looking at it graphically.
April 6, 2009 at 9:34 pm |
I enjoyed reading that paper a while back and have just bought your book.
Recently, I’ve heard it claimed that things have changed for the NFL draft.
I have my doubts. Do you know if anyone has been tracking the data?
May 2, 2009 at 7:08 pm |
After looking at that link from the “thanks to an enterprising NFL fan” It seems like the best value comes from picks 15-30 in the first round. Has anyone applied this theory to all the picks in say the last 20 years to see if there is any merit in this theory?
May 27, 2010 at 5:50 am |
As a Chicago Bears fan, I know this better than most. Our GM has blown tons of round 1/2 picks, but we have gotten great productivity out of many 3-5th rounders. EM – Chicago Bears Hats